Disclaimer
Value Situations is NOT investment advice and the author is not an investment advisor.
All content on this website and in the newsletter, and all other communication and correspondence from its author, is for informational and educational purposes only and should not in any circumstances, whether express or implied, be considered to be advice of an investment, legal or any other nature. Please carry out your own research and due diligence.
The Value Sits Model Portfolio continued its positive trajectory in Q2, appreciating +3.0% for the quarter, underperforming the S&P 500 (SPX) by -5.3% (SPX +8.3% in Q1) but outperforming the European STOXX 600 (SXXP) by +2.1% (SXXP +0.9% in Q1).
On a YTD basis, the Model Portfolio is up +14.1%, trailing the SPX by -1.8% (SPX +15.9% YTD) but outperforming the SXXP by +5.4% (SXXP +8.7% YTD). [note all YTD returns are to the 30 June for purposes of end of Q2 review].
However a major driver of SPX’s performance this year (and thus the Model Portfolio’s relative underperformance against it) has been the performance of what I previously termed the FAANGs / FAAMGs complex, which originally included Facebook/Meta, Amazon, Apple, Netflix, Google/Alphabet and Microsoft. More recently, Yardeni Research has expanded this group to include Tesla and Nvidia in this megacap, tech-related cohort, and refers to this expanded group as the “Megacap 8.”
As at the end of Q2, the Megacap 8 accounted for ~27% of the SPX index, an all-time high in terms of index concentration among these names, and recently prompting Barron’s to more broadly describe the SPX as a “megacap tech fund”:
Source: Yardeni Research.
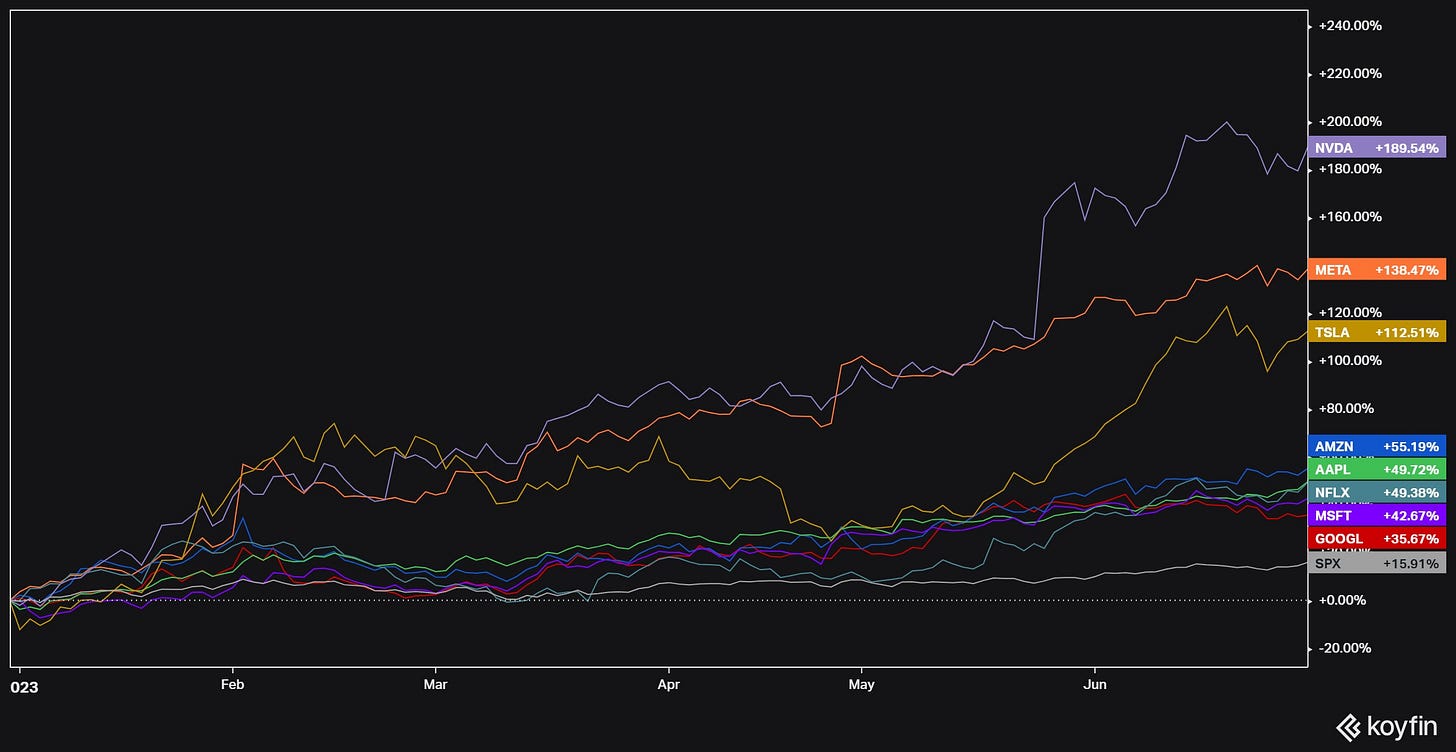
Given the extent of the Megacap 8’s weighting in the SPX it is obvious that much of the index’s impressive +15.9% performance YTD is directly attributable to these 8 names which are up ~77% YTD on a simple average basis - Nvidia is the star performer among them, up +190% YTD propelled by the wave of investor enthusiasm for anything related to artificial intelligence:
In fact, Yardeni’s analysis indicates that the SPX’s performance YTD is entirely attributable to the Megacap 8, as the charts below show:
Source: Yardeni Research.
In both the above charts, the green line represents the SPX excluding the Megacap 8, with the orange box highlighting H1-23 performance.
What does this tell us? Simply put, the way to make money in H1 was to buy the Megacap 8, or even just Nvidia, but that’s obviously with the benefit of hindsight which is always 20/20. Who knew that AI would be this years winning thematic trade in the same way energy was in H1 2022?
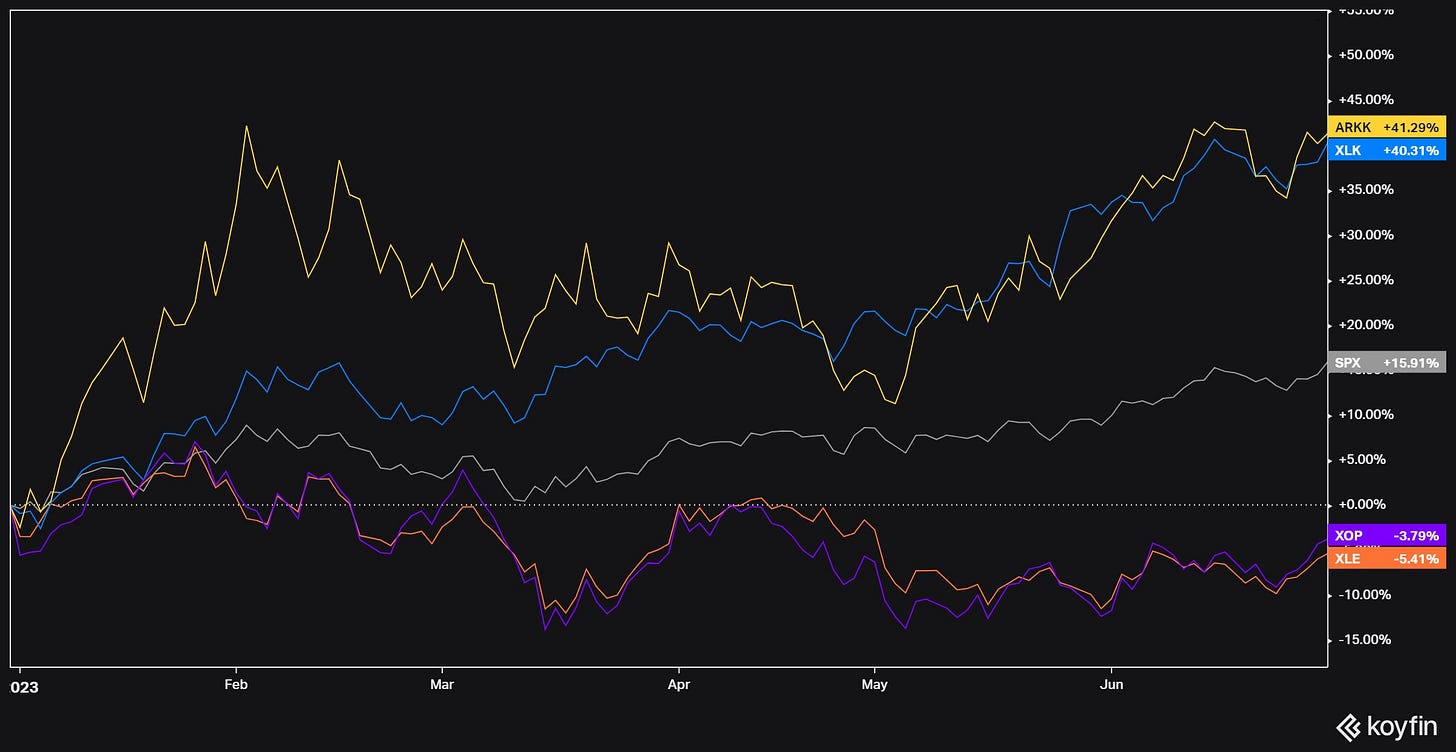
Instead, perhaps a more foreseeable bet would have been a simple “reverse 2022” trade rotating out of energy and into tech, expressed as long tech XLK / ARKK and short energy XLE / XOP:
Side note: Interestingly, over a trailing 18 month period, since the end of 2021 energy remains the winning thematic trade:
H1’s tech rebound seems largely attributable to short-term expectations that I believe will prove to be misguided, being (a) a view that interest rates will be cut and revert to previous cycle/ pre-COVID levels, boosting the valuations of perceived high-growth tech stocks again, and (b) these tech names will far outgrow all other types of businesses, with buzzwords such as AI and the metaverse capturing investors imagination (rather than their reasoning ability) - it is very possible that AI may prove to be this years market hype theme, similar to meme stocks or crypto in previous years, and related stocks will eventually come back down to earth - interestingly, ChatGPT is already starting to experience a decline in traffic and usage. In this light, Nvidia trading at 166x LTM EBITDA can hardly be viewed as offering a great risk/reward profile.
In understanding what’s really driven YTD market performance (speculative/hype tech), I actually feel less disappointed with the Model Portfolio’s relative underperformance vs the SPX in Q2.
Given the short-term speculative feel to the Megacap 8’s performance, I’m comfortable having no exposure to these names in the Model Portfolio. Furthermore, I would suggest that the performance of these megacaps is unlikely to be sustainable through to year-end. Recall again that the SPX’s performance excluding these megacaps is flat YTD and in this light the Model Portfolio’s +14.1% performance is more than satisfactory on a relative basis at least. Moverover, the Portfolio adheres to Warren Buffett’s Rule No. 1: Never lose money, having delivered positive absolute performance across Q2, YTD and since inception periods, as outlined below.
The Model Portfolio holds 8 names as at the end of the quarter, after the addition of one new position in May. I outline my latest thoughts on each below, starting off with a review of how the overall Portfolio was positioned as at the end of Q2.


